22 Jun 2020

RSN Member Insights is the place to discover the statistics that define communities within our membership. It is regularly updated with new analyses, and these will be highlighted in the ‘What’s New’ section of the RSN’s Weekly Rural Bulletin. The Rural Bulletin also provides the most relevant rural news, so do subscribe and encourage your colleagues to subscribe to what is an invaluable weekly periodical.
In this edition of the ‘Spotlight on RSN Member Insights’, Dan Worth, our Research and Performance Analyst explores the current Covid inspired push to cycling for travel, and considers how it fits within the rural context.
Background
The corona virus pandemic continues to present daily challenges in people’s lives, particularly as restrictions are relaxing and opportunities to move back into some form of normal living increase. One particular challenge is in delivering safe travel, away from public transport, that does not force the public into their cars or exclude them from work and life opportunities. Social distancing within public transport is inherently difficult, and so to minimise the transmission of the corona virus there is an expectation that the use of public transport is for key workers. In light of this there is now a significant focus on encouraging bicycle use, and a number of schemes are in the process of being rolled out around the country to assist people moving to two wheels. In this Spotlight, we examine the data that can inform the conversation around bicycle use in rural areas.
Health and the Environment
Prior to the pandemic, cycling had already been identified as an important form of transport due to its health and environmental benefits.
Public Health England state that:
‘Physical inactivity is the 4th leading risk factor for global mortality accounting for 6% of deaths globally. People who have a physically active lifestyle have a 20-35% lower risk of cardiovascular disease, coronary heart disease and stroke compared to those who have a sedentary lifestyle. Regular physical activity is also associated with a reduced risk of diabetes, obesity, osteoporosis and colon/breast cancer and with improved mental health. In older adults physical activity is associated with increased functional capacities.’
In 2018/19 there were 876 thousand hospital admissions where obesity was recorded as the primary or a secondary diagnosis. (Statistics on Obesity, Physical Activity and Diet, England, 2020, NHS Digital)
So there are clear positive health outcomes for those adopting cycling as their transport solution, and this is reflected in 2019 guidelines on the amount of activity recommended for health as published by the Chief Medical Officers of the four UK countries. They state that:
Adults (aged 19 and over) should aim to be active daily. Over a week, activity should add up to at least 150 minutes of moderate intensity activity or 75 minutes of vigorous intensity activity per week, or a combination of both.
Adults should also aim to build strength on at least two days a week.
Children and young people (aged 5 to 18) should aim to be physically active for at least 60 minutes per day across the week.
In terms of the environment, in 2015 the transport sector accounted for 24% of the UK’s greenhouse gas emissions. The Government’s Clean Growth Strategy talks about the importance of reducing the number of shorter journeys made by car, emphasising the need to support people to use alternative forms of transport for these trips. As well as the health benefits for the individual who adopts active travel for their shorter journeys, there are shared health benefits in terms of reduced air pollution. The Department of Health’s Committee on the Medical Effects of Air Pollutants (COMEAP) estimated the burden of particulate matter air pollution in the UK in 2008 to be equivalent to nearly 29,000 deaths.
Cycling in the Rural Environment
Converting this understanding of the positive outcomes that cycling for transport can bring, into long term behavioural change has a number of challenges in the rural environment. The distance to access services, the state of the road network, and the fear of being involved in an accident are all practical considerations that need to be addressed.
The sheer length of road network in rural areas is a challenge that rural local authorities have to tackle in considering cyclists as uses. 37.1% of the total road network length in England exists in Predominantly Rural upper tier local authority areas. By comparison, 34.8% of the total road network length runs through Predominantly Urban areas.
The average percentage of local authority maintained non-principal roads where maintenance should be considered in 2019 was 6% in Predominantly Rural areas compared to 4% in Predominantly Urban areas, this equates to roughly 1,200 more miles of road maintenance across England.
These figures indicate the disproportionate length of road network that Predominantly Rural local authorities have to consider in terms of cycling infrastructure and maintenance in comparison to their resident populations (approximately 20% of England’s population live in Predominantly Rural areas).
A result of fewer people accessing a longer road network is that average road speeds on local ‘A’ roads are typically greater in Predominantly Rural authority areas. This might deter people from turning to cycling for transport due to the perceived greater risk of any accident. However data on casualties as a proportion of population shows that between car users, pedestrians and cyclists, cyclists have fewer reported casualties. This is also reflected in the number of casualties that are killed or seriously injured, and for both pedestrians and cyclists, the proportions are less in Predominantly Rural areas than Urban.
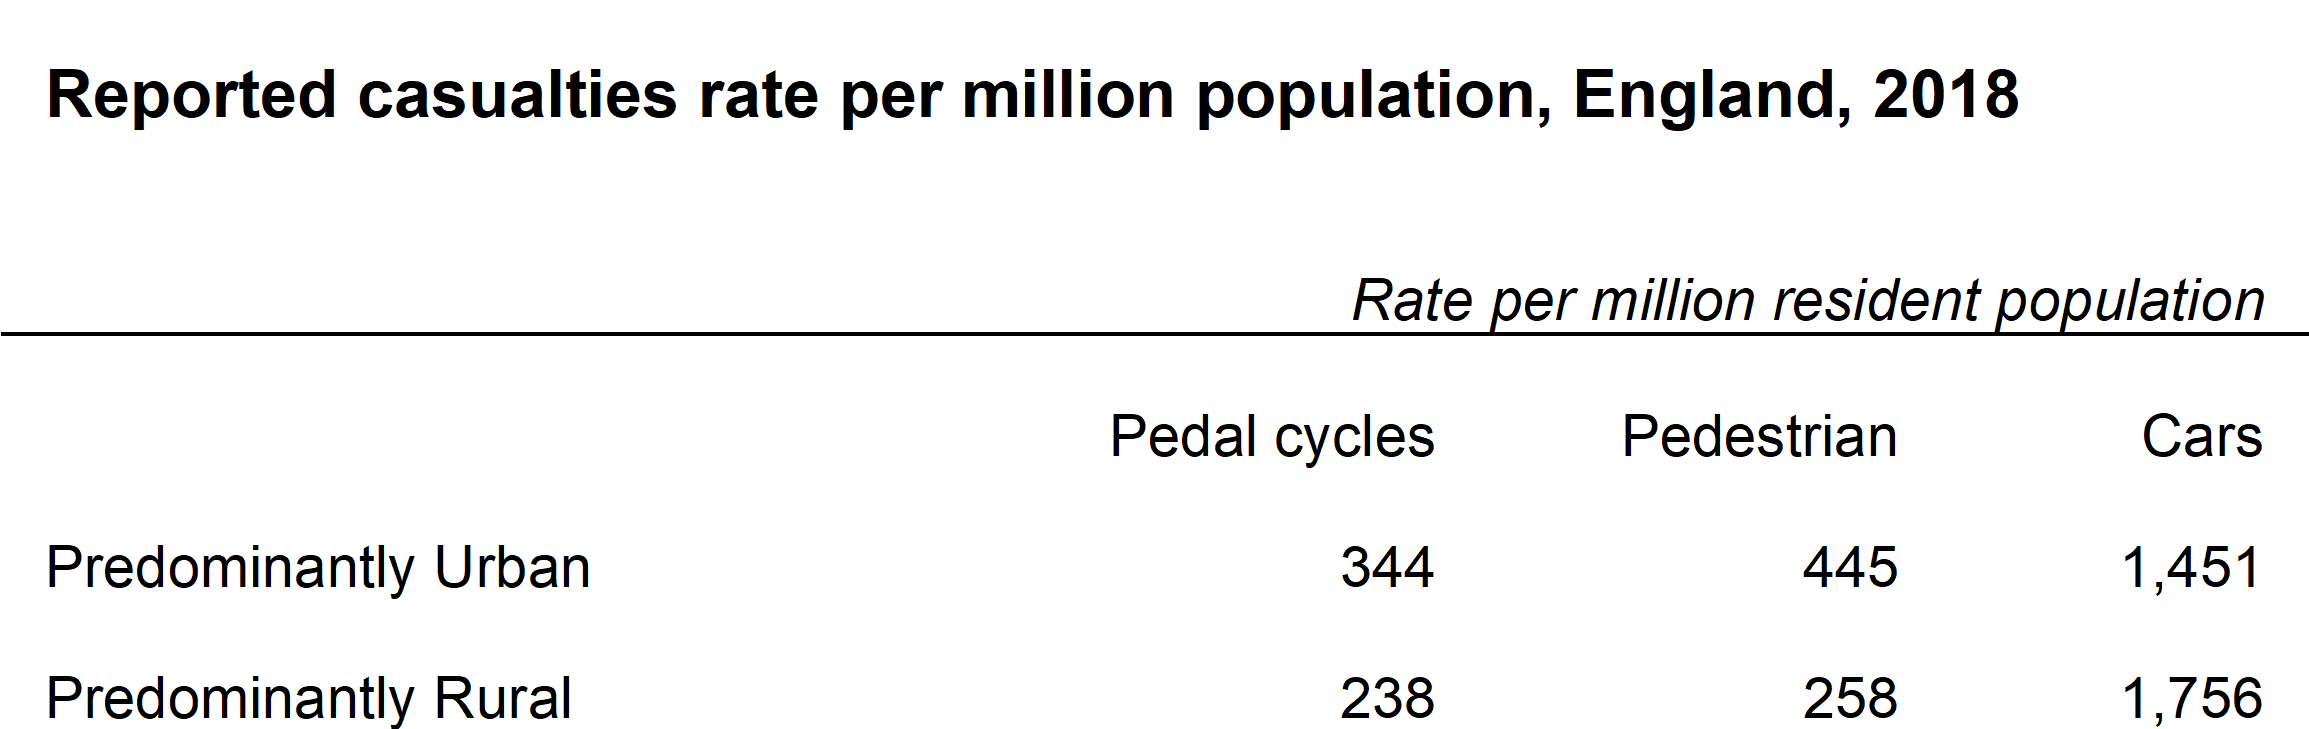 |
Looking conversely at accident rates per billion vehicle miles reported in 2018, the rate for pedal cycles is second highest with only motorcycles ahead for all rural roads, but is still significantly less than the rates on all urban roads.
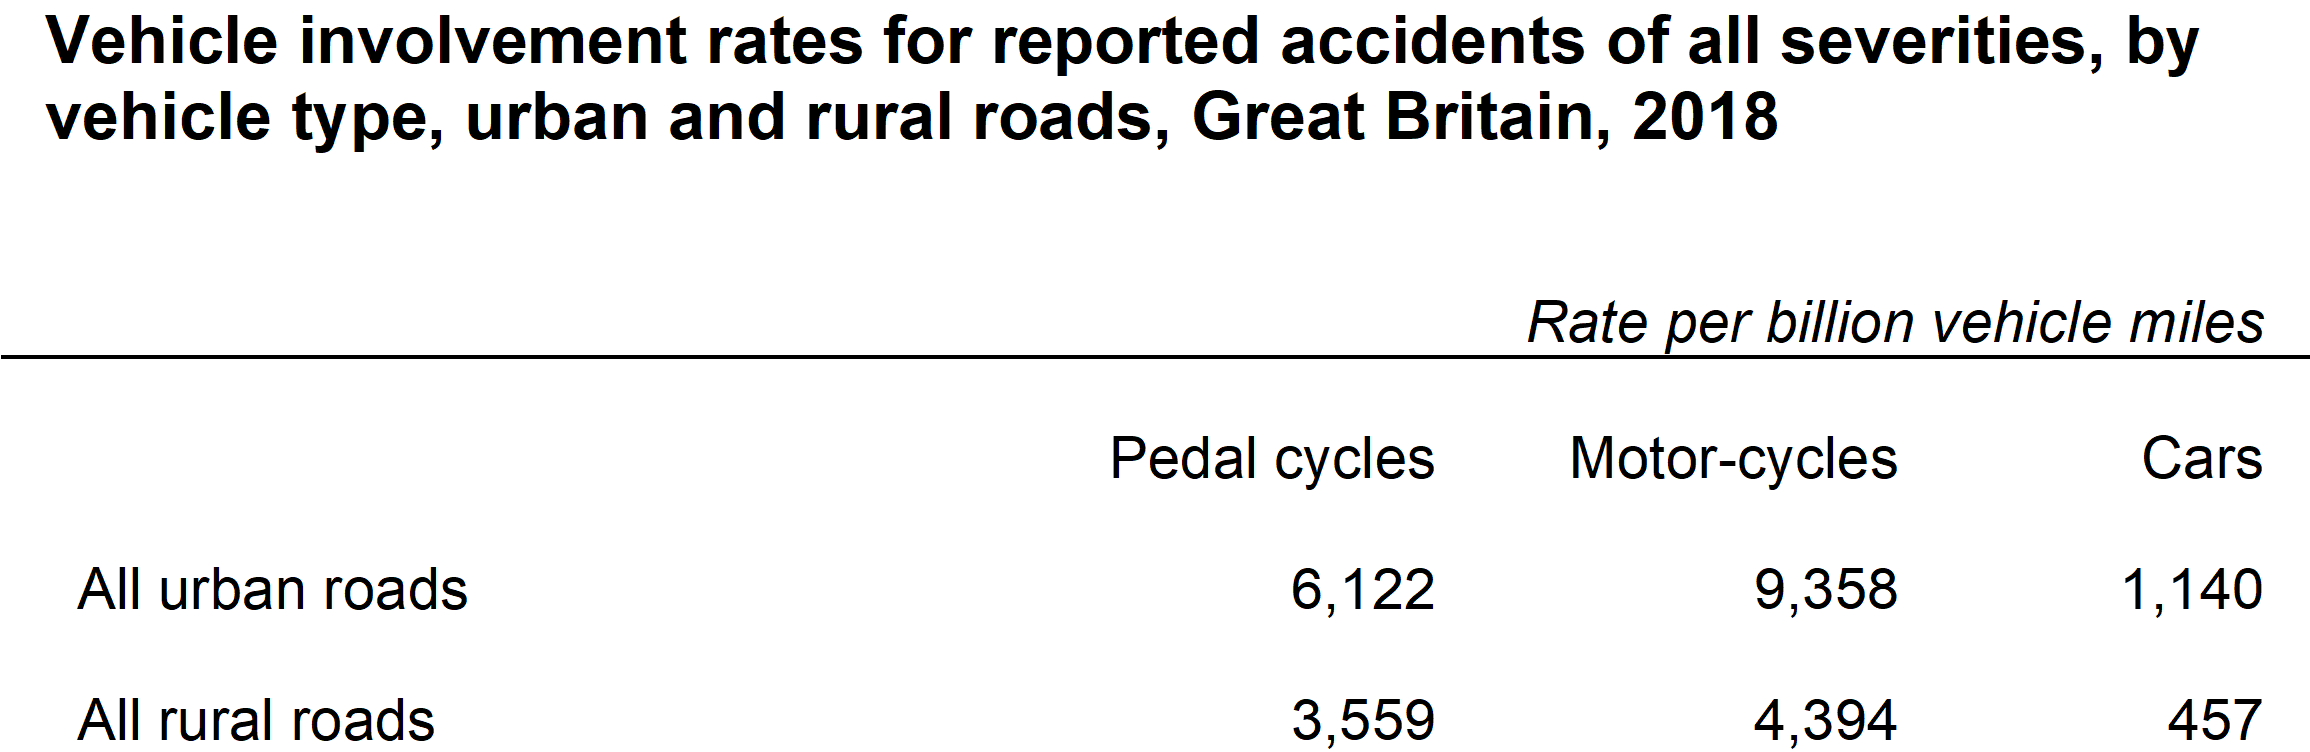 |
As mentioned previously, active travel reduces air pollution. One measure of air pollution is the mass concentration of particulate matter that is generally less than 2.5 mm aerodynamic diameter (PM2.5). This fraction can penetrate deep into the lungs. Using data from Public Health England, the fraction of deaths for those aged 25+ attributable to this pollutant is lower in Predominantly Rural local authority areas, with an average of 4.7% compared with 5.8% in Predominantly Urban areas. This is positive for those living in Predominantly Rural areas in two regards. Firstly the situation as it stands is better in rural areas, as one would expect. Secondly, it is a more attractive proposition to cycle where pollution is lower and the positive effect of increased active travel is the further reduction of PM2.5 and other air pollutants.
Looking at the current picture of bicycle use in the rural context, the National Travel Survey indicates that average trip lengths by bicycle in 2017/2018 were:
3.7 miles where the region of residence was classed as Rural Town & Fringe
5.0 miles where the region of residence was classed as Rural Village, Hamlet and Isolated Dwelling
and 3.4 miles for England overall
The National Travel Survey also indicates that the percentage of trips to and from school for those aged 5-16 years by bicycle in 2017/18 were:
1.9% where the region of residence was classed as Rural Town & Fringe (with average trip lengths for all modes of transport of 1.8 miles for those aged 5-10 years, 4.3 miles of those aged 11-16 years)
0.6% where the region of residence was classed as Rural Village, Hamlet and Isolated Dwelling (with average trip lengths for all modes of transport of 3.5 miles for those aged 5-10 years, 7.5 miles of those aged 11-16 years)
and 2.4% for England overall (with average trip lengths for all modes of transport of 1.5 miles for those aged 5-10 years, 3.5 miles of those aged 11-16 years)
Taking data from Sport England’s Active Lives Survey we see that fewer people cycle for travel in rural England, and the proportion of people that do, decreases with increasing rurality.
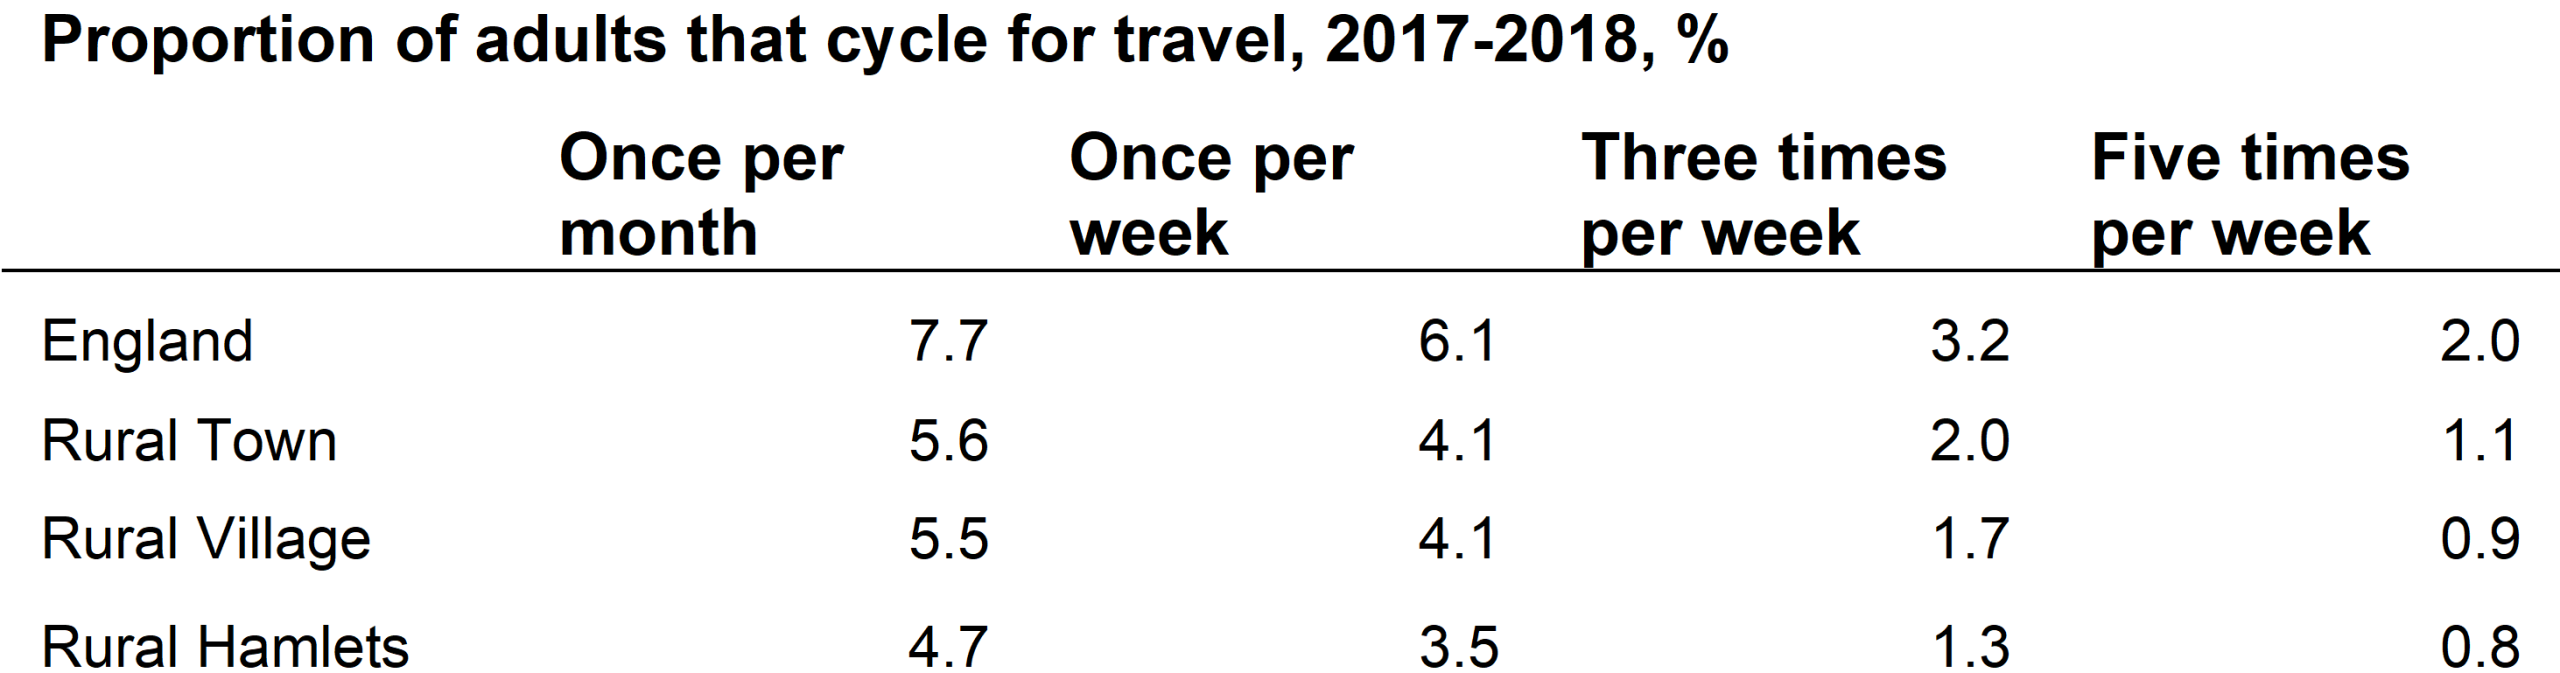 |
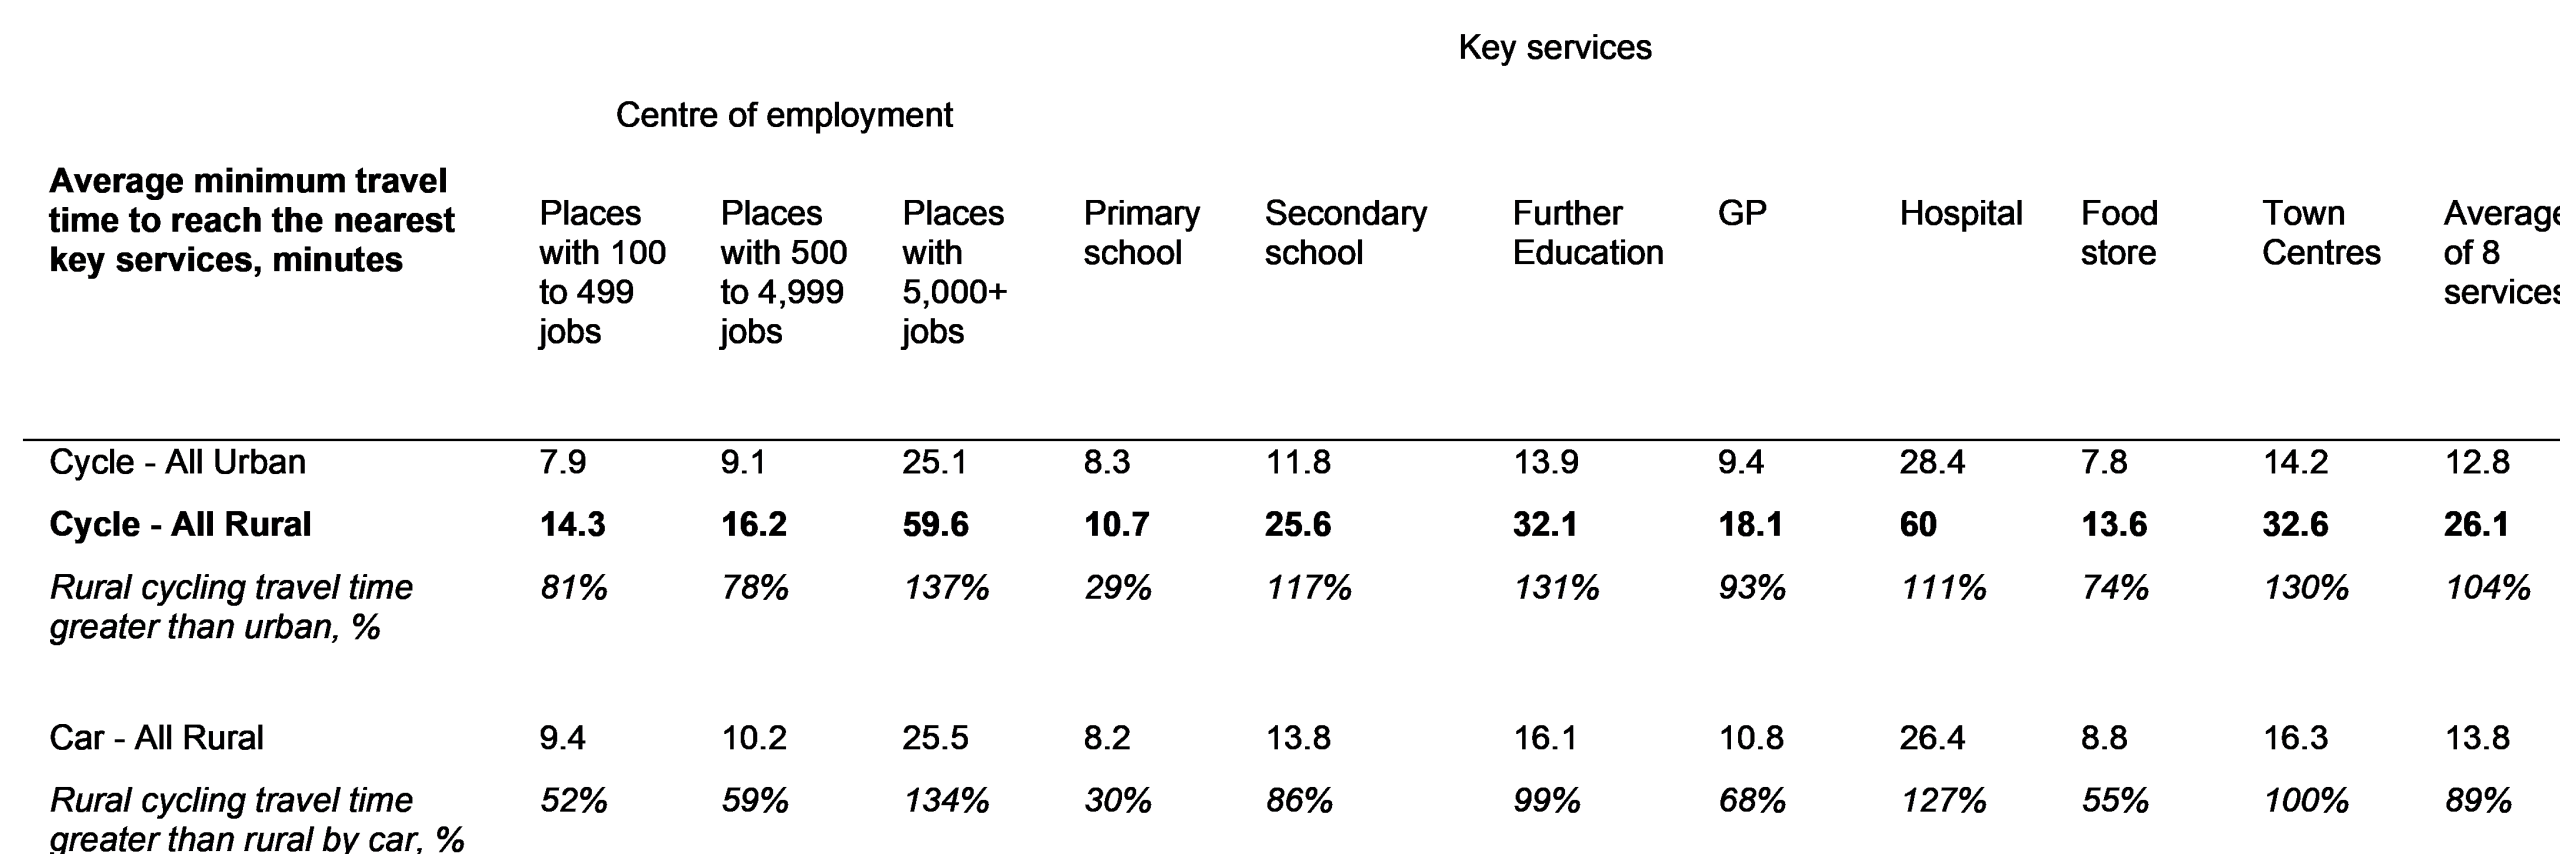
In terms of access to key services, the average minimum travel times do demonstrate the challenge in incorporating cycling for travel into daily routines. The average minimum travel time for cycling over 8 services is twice as great in rural areas as it is in urban areas, as shown in the below table. Also the average over 8 services is nearly twice as great in rural areas when travelling by bicycle as it is in rural areas when travelling by car. The average minimum travel time in a rural situation is smallest for access to primary schools, however the age profile of those needing to access this service is a huge consideration as to whether cycling for travel could be increased in this instance.
Conclusion
Health and environmental benefits of cycling are clear drivers for encouraging bicycle use for rural and urban areas of England alike. There are however clear hurdles in mobilising the rural population in embracing this form of travel beyond that of being a leisure pursuit. The perception of the dangers involved do not necessarily match the reality, however they clearly need to be addressed since the data paints a mixed picture. Upper tier rural local authorities are challenged by the length of road they have responsibility for, and thus needs consideration in terms of cycling infrastructure and maintenance. There also needs to be acceptance that cycling for transport is not practically possible to access all services starting from a rural location, but might be made more accessible when cycling is considered alongside and connected with other transport solutions.
Infrastructure and behaviour change campaigns need to fit the environment to which cycling for transport is intended, and funding needs to be available to unlock the potential. According to the February 2020 report to Parliament, ‘Cycling and Walking Investment Strategy, Moving Britain Ahead’, average spending by surveyed local authorities was around £4 per person per year in 2018/19 in rural areas. This compares to an average spend of £9 per person per year in urban areas. The Rural Services Network campaigns for fair funding for rural service providers so that rural residents get a fair deal in the services they receive.
Data Sources
Department for Transport, Table RDL0102a, Total road length by road type and local authority
Department for Transport, Table RDC0120, Principal and non-principal classified roads where maintenance should be considered
Department for Transport, Table CGN0501b, Average speed on local ‘A’ roads
Department for Transport, Table RAS30043, Reported casualties
Department for Transport, Table RAS20005, Vehicle involvement rates for reported accidents
Department for Transport, Table CW0305, Proportion of adults that walk or cycle
Department for Transport, Table JTS0102, Average minimum travel time
DEFRA, Statistical Digest of Rural England, March 2020 Edition
Public Health England, Estimating Local Mortality Burdens associated with Particulate Air Pollution