T: 01822 851370 E: [email protected]
Take part in our survey about life in rural England
Visit RSN Survey about life in rural England to find out more.
10.07.2014
Solihull
|
Working for our part of Rural England with the Rural Services Network |
|
|
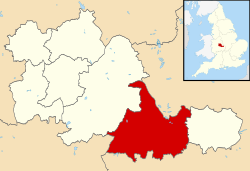
Location: West Midlands Population: 210,445 (Mid-year estimate 2015) Interesting fact: Solihull is the best place to live in the UK, according to a new Quality of Life Index from uSwitch (Nov 2013)
|
||||
| Solihull |
Solihull is a member of the Rural Services Network and falls |
||||
Solihull Information |
||
| Phone number 0121 704 6000 |
Website www.solihull.gov.uk |
Local Enterprise Partnerships (LEPs) Greater Birmingham and Solihull |
| Frequency of elections Elections are by thirds |
Number of councillors 51 |
Political composition Conservative - 32 Green - 10 Lib Dem - 6 UKIP - 2 Labour - 1 |
| MPs Meriden - Caroline Spelman (Conservative) Solihull - Julian Knight (Conservative) |
Decision making structure Leader and a Cabinet |
Population change Population change One Year Population Change + 0.3% Ten Year Population Change + 4.4% |
| Police Authority West Midlands Police Authority |
Fire Service West Midlands Fire Service |
Health Authority NHS West Midlands |
| Area 17,819 Hectares |
Rural Output Areas 65 rural OAs from 667 OAs in total |
Audited by Central Region (Audit Commission) |
| Rural Classification (Defra) Urban with Major Conurbation |
Population by Area- (Density) 11.81 people per hectare |
Number of Parishes 16 |
| Number of Parish Meetings 0 |
Number of Parish Councils 14 |
Number of Town Councils 2 |
| Average house price £240,000 (Median price paid by local authority, year ending Q4-2015 - provided by UK HPI data published by Land Registry © Crown copyright 2016) |
Outsourced Services Information yet to be supplied |
Average age of population 41.3 (2011 Census data) |
| Main Towns Chelmsley Wood, Fordbridge, Solihull |
Unemployment rate 1.1% (JSA claimants for August 2017) |
Current Council Tax (amount reported is the amount received by the Council - no other services are included) 2014/2015 Council Tax - £1,173.72 2015/2016 Council Tax - £1,173.72 2016/2017 Council Tax - £1,185.34 2017/2018 Council Tax - £1,269.13 |
| Percentage of households socially rented from council or local authority 11.9% (2011 Census data) |
Percentage of population who have reported they are in very good health 47.5% (2011 Census data) |
Percentage of population which provides unpaid care 11.7% (2011 Census data) |
| Employment by Occupation Percentage of people aged 16 and over who are in Social Major Group 1-3 48.3% (ONS annual population survey - April 15-March 16) |
Average annual wage for full time employees
|
Percentage of those employed in full time employment 39.9% (2011 Census data) |
| Cars or vans owned per household (2011 Census data) No cars or vans - 19.7% 1 car or van - 39.5% 2 cars or vans - 30.9% 3 cars or vans - 7.4% 4 or more cars and vans - 2.5% |
Local Newspapers Information yet to be supplied |
National Park/AONBs None |
2015 English Indices of Deprivation analysis tool
(Produced by Oxfordshire County Council) |
||

(All factual information on these pages is updated annually by the RSN)
(Information given via links will however be updated as new information becomes available)


