T: 01822 851370 E: [email protected]
Take part in our survey about life in rural England
Visit RSN Survey about life in rural England to find out more.
27.08.2014
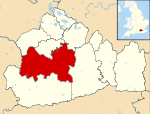
Guildford
|
Working for our part of Rural England with the Rural Services Network |
|
|
Location: South East Population: 146,080 (Mid-year estimate 2015) Interesting fact: The Omen (1976) was filmed at Guildford Cathedral
|
||||
| Guildford |
Guildford is a member of the Rural Services Network and falls |
||||
Guildford Information |
||
| Phone number 01483 505050 |
Website www.guildford.gov.uk |
Local Enterprise Partnerships (LEPs) Enterprise M3 |
| Frequency of elections Elections are of whole council |
Number of councillors 48 |
Political composition Conservative Party - 34 Liberal Democrats - 9 Guildford Greenbelt group - 3 Labour - 2 |
| MPs Guildford - Anne Milton (Conservative) Mole Valley - Paul Beresford (Conservative) Surrey Heath - Michael Gove (Conservative) Woking - Jonathan Lord (Conservative) |
Decision making structure Leader and a Cabinet |
Population change Population change One Year Population Change + 2.2% Ten Year Population Change + 13.2% |
| Police Authority Surrey Police Authority |
Fire Service Surrey Fire and Rescue |
Health Authority South East Coast Strategic Health Authority |
| Area 27,091 Hectares |
Rural Output Areas 115 rural OAs from 435 OAs in total |
Audited by Southern Region (Audit Commission) |
| Rural Classification (Defra) Urban with City and Town |
Population by Area- (Density) 5.39 people per hectare |
Number of Parishes 24 |
| Number of Parish Meetings 0 |
Number of Parish Councils 23 |
Number of Town Councils 0 |
| Average house price £379,475 (Median price paid by local authority, year ending Q4-2015 - provided by UK HPI data published by Land Registry © Crown copyright 2016) |
Outsourced Services Information yet to be supplied |
Average age of population 39.0 (2011 Census data) |
| Main Towns / Cities Guildford |
Unemployment rate 0.4% (JSA claimants for August 2017) |
Current Council Tax (amount reported is the amount received by the Council - no other services are included) 2014/2015 Council Tax - £149.58 2015/2016 Council Tax - £151.82 2016/2017 Council Tax - £156.82 2017/2018 Council Tax - £161.82 |
| Percentage of households socially rented from council or local authority 9.1% (2011 Census data) |
Percentage of population who have reported they are in very good health 53.9% (2011 Census data) |
Percentage of population which provides unpaid care 9.1% (2011 Census data) |
| Employment by Occupation Percentage of people aged 16 and over who are in Social Major Group 1-3 54.4% (ONS annual population survey - April 15-March 16) |
Average annual wage for full time employees
|
Percentage of those employed in full time employment 41.1% (2011 Census data) |
| Cars or vans owned per household (2011 Census data) No cars or vans - 13.9% 1 car or van - 40.0% 2 cars or vans - 33.9% 3 cars or vans - 8.6% 4 or more cars and vans - 3.6% |
Local Newspapers Information yet to be supplied |
National Park/AONBs Surrey Hills (AONB) |
2015 English Indices of Deprivation analysis tool
(Produced by Oxfordshire County Council) |
||

(All factual information on these pages is updated annually by the RSN)
(Information given via links will however be updated as new information becomes available)


