T: 01822 851370 E: [email protected]
Visit RSN Survey about life in rural England to find out more.
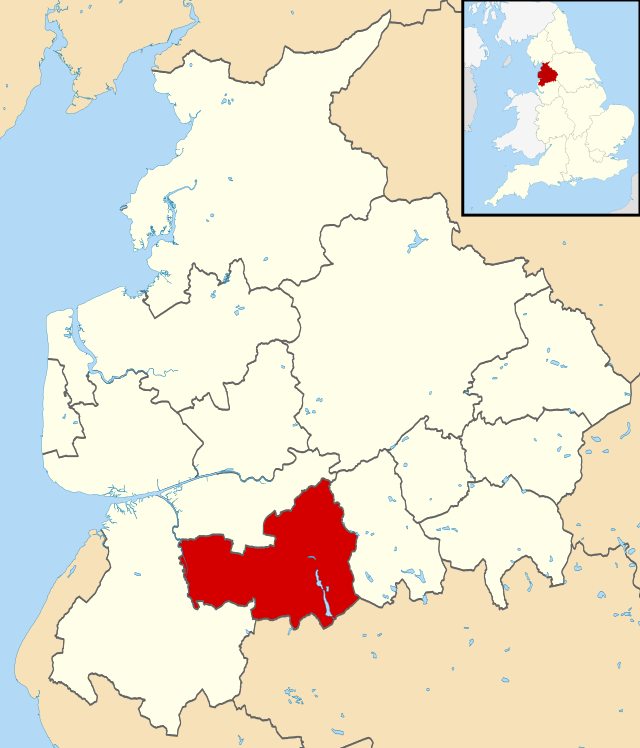
Chorley
|
Working for our part of Rural England with the Rural Services Network |
|
|
Location: North West Population: 114,400 (2016) Interesting fact: Chorley played an important role during the Second World War, when it was home to the Royal Ordnance Factory, a large munitions manufacturer in the village of Euxton about 2 miles (3.2 km) from the town centre. A smaller factory was also built near the Blackburn-Wigan railway line in Heapey.
|
||||
| Chorley |
Chorley is a member of the Rural Services Network and falls |
||||
Chorley Information |
||
| Phone number 01257 515151 |
Website www.chorley.gov.uk |
Local Enterprise Partnerships (LEPs) Lancashire |
| Frequency of elections Elections are by thirds |
Number of councillors 47 |
Political composition Labour - 29 Conservative Party - 14 Independent Group - 2 Independent Member - 2 |
| MPs Chorley - Lindsay Harvey Hoyle (Labour) |
Decision making structure Leader and a Cabinet |
Population change Population change One Year Population Change + 1.2% Ten Year Population Change + 9.4% |
| Police Authority Lancashire Police Authority |
Fire Service Lancashire Fire and Rescue Service |
Health Authority North West Strategic Health Authority |
| Area 20,280 Hectares |
Rural Output Areas 107 rural OAs from 355 OAs in total |
Audited by Northern Region (Audit Commission) |
| Rural Classification (Defra) Urban with Significant Rural (rural including hub towns 26-49%) |
Population by Area- (Density) 5.57 people per hectare |
Number of Parishes 23 |
| Number of Parish Meetings 0 |
Number of Parish Councils 22 |
Number of Town Councils 1 |
| Average house price £162,500 (Median price paid by local authority, year ending Q4-2015 - provided by UK HPI data published by Land Registry © Crown copyright 2016) |
Outsourced Services Information yet to be supplied |
Average age of population 40.5 (2011 Census data) |
| Main Towns Adlington, Chorley |
Unemployment rate 0.7% (JSA claimants for August 2017) |
Current Council Tax (amount reported is the amount received by the Council - no other services are included) 2014/2015 Council Tax - £177.41 2015/2016 Council Tax - £177.41 2016/2017 Council Tax - £177.41 2017/2018 Council Tax - £180.96 |
| Percentage of households socially rented from council or local authority 3.1% (2011 Census data) |
Percentage of population who have reported they are in very good health 47.9% (2011 Census data) |
Percentage of population which provides unpaid care 11.4% (2011 Census data) |
| Employment by Occupation Percentage of people aged 16 and over who are in Social Major Group 1-3 47.1% (ONS annual population survey - April 15-March 16) |
Average annual wage for full time employees
|
Percentage of those employed in full time employment 41.5% (2011 Census data) |
| Cars or vans owned per household (2011 Census data) No cars or vans - 17.1% 1 car or van - 41.2% 2 cars or vans - 32.8% 3 cars or vans - 6.7% 4 or more cars and vans - 2.3% |
Local Newspapers Information yet to be supplied |
National Park/AONBs None |
2015 English Indices of Deprivation analysis tool
(Produced by Oxfordshire County Council) |
||

(All factual information on these pages is updated annually by the RSN)
(Information given via links will however be updated as new information becomes available)


